
FIGURE 7.
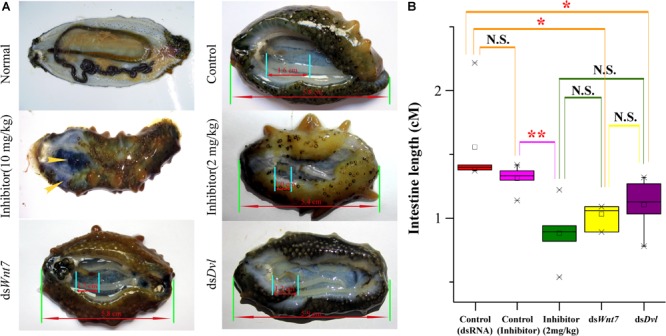
The intestinal regeneration after injection of dsRNA and inhibitor. (A) Photos of the intestinal regeneration after injection of inhibitor (10 and 2 mg/kg), dsWnt7, dsDvl, and dsEGFP (Control). As the performance of the negative controls of dsRNA and inhibitor were similar, only the control of dsRNA was displayed. (B) Distributions of the intestinal lengths of different treatment groups. Independent samples t-test was used to test the significant differences. ∗∗p < 0.01, ∗p < 0.05, and N.S., significant differences.