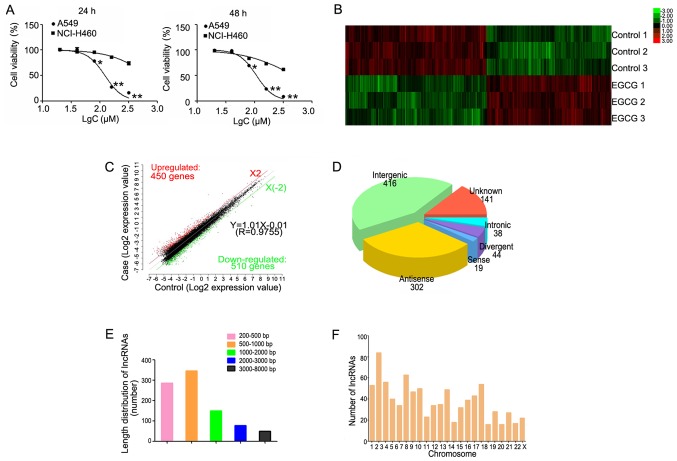
Figure 1.
Hierarchical clustering of differentially expressed lncRNAs. (A) The survival rate of lung cancer cells following treatment with EGCG detected by MTT assay. (B) Hierarchical clustering of 3 EGCG-treated samples (EGCG1-3) versus 3 untreated samples (CON1-3) was based on the 960 dysregulated lncRNAs. Red represents upregulated lncRNAs, while green represents downregulated lncRNAs. (C) Red, black, and green dots represent lncRNAs with expression that was increased, equivalent, or decreased between the EGCG-treated and control groups. (D) Length distribution of 960 differentially expressed lncRNAs. (E) Class distribution of dysregulated lncRNAs, including 416 intergenic, 302 antisense, 141 unknown, 44 divergent, 38 intronic, and 19 sense lncRNAs. (F) Chromosome enrichment analysis of 960 differentially expressed lncRNAs on chromosomes (DNA). *P<0.05, **P<0.01 vs. NCI-H460. EGCG, (−)-epigallocatechin-3-gallate; lncRNA, long non-coding RNA.

