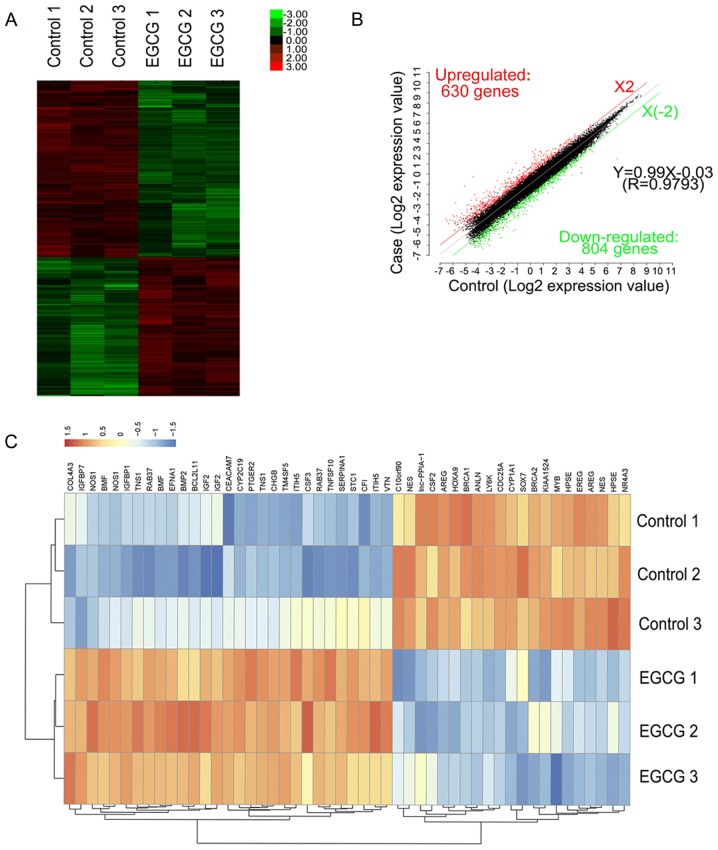
Figure 2.
Hierarchical clustering of the differentially expressed mRNAs. (A) Hierarchical clustering of 3 EGCG treatment samples (EGCG1-3) versus 3 untreated samples (CON1-3) was based on the 1,434 dysregulated mRNAs. Red represents upregulated mRNAs, while green represents downregulated mRNAs. (B) Red, black, and green dots represent mRNAs with expression that was increased, equivalent, or decreased between the EGCG-treated and control groups. (C) Known lung cancer oncogenes in the heat map were significantly differentially expressed following EGCG treatment. EGCG, (−)-epigallocatechin-3-gallate; lncRNA, long non-coding RNA.

