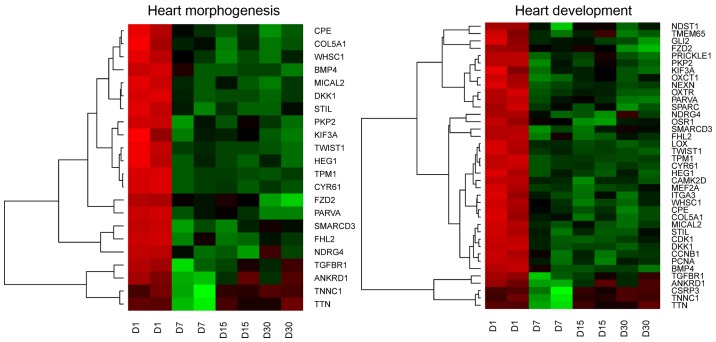
Figure 1.
Heat map representation of differentially expressed genes belonging to the ‘heart morphogenesis’ and ‘heart development’ Gene Ontology Biological Process terms. Arbitrary signal intensity acquired from microarray analysis is represented by colours (green indicates higher and red indicates lower expression). Log2 signal intensity values for any single gene were resized to Row Z-Score scale (from −2, the lowest expression to +2, the highest expression for a single gene).

