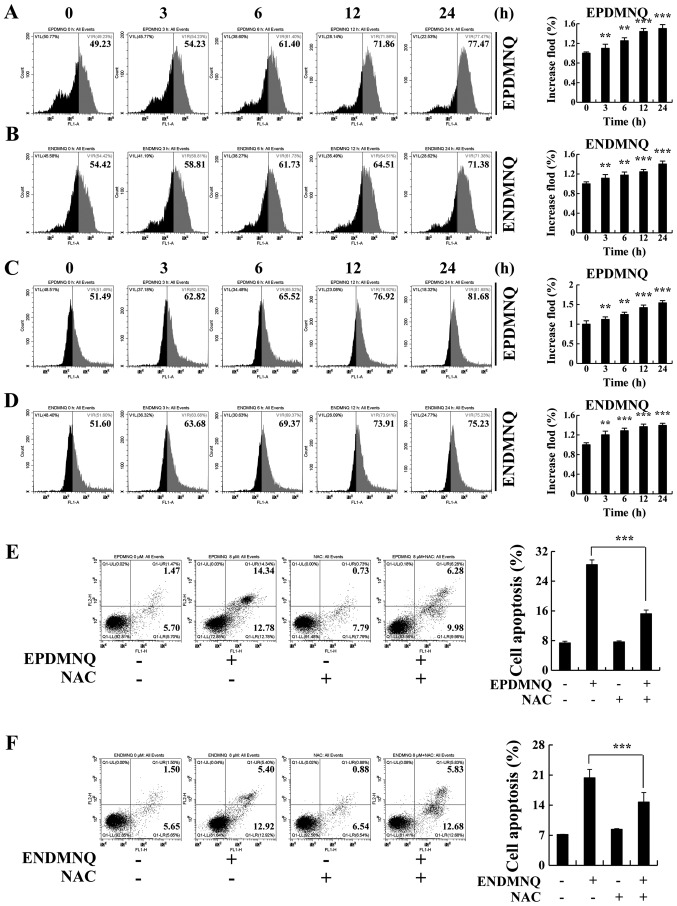
Figure 5.
EPDMNQ and ENDMNQ-induced apoptosis is restored by ROS inhibition in Hep3B cells. (A and B) Intracellular ROS generation induced by EPDMNQ or ENDMNQ was measured in Hep3B cells following staining with 2′,7′-dichlorodihydrofluorescein diacetate and detected by flow cytometry. (C and D) Hep3B cells were treated with EPDMNQ or ENDMNQ for 24 h, and mitochondrial membrane potential depolarization value was detected by flow cytometry following JC-1 staining. (E) Hep3B cells were treated with NAC for 30 min and then incubated with EPDMNQ for 24 h. Cell apoptosis was determined by flow cytometry. (F) Apoptotic cell numbers were detected following ENDMNQ treatment by flow cytometry. Data are expressed as the apoptotic cell numbers. **P<0.01 and ***P<0.001 vs. untreated control group. EPDMNQ, 2,3-dihydro-2,3-epoxy-2-propylsulfonyl-5,8-dimethoxy-1,4-naphthoquinone; ENDMNQ, 2,3-dihydro-2,3-epoxy-2-nonylsulfonyl-5,8-dimethoxy-1,4-naphthoquinone; ROS, reactive oxygen species; NAC, N-acetyl-L-cysteine.

