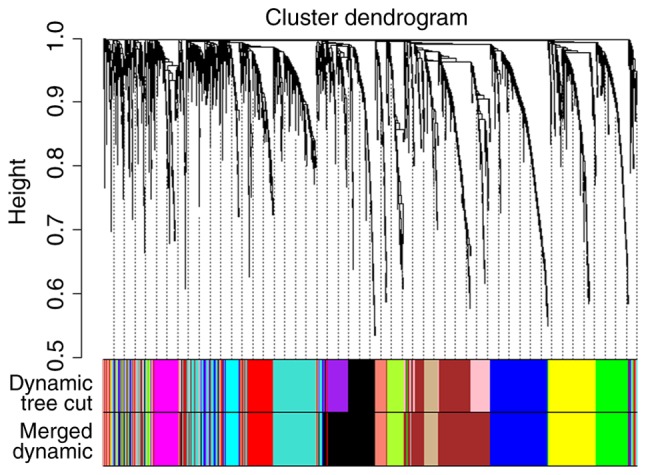
Figure 2.

Hierarchical clustering dendrograms of identified co-expressed genes in modules. The dendrogram was generated by unsupervised hierarchical clustering of genes using topological overlap. The colored strips below each dendrogram indicate the module designation identified though the clusters of co-expressed genes, and assigned the merged module color to the original module color.
