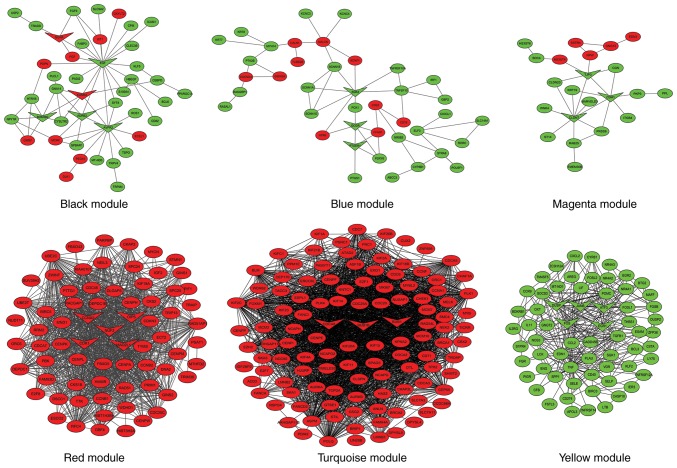
Figure 3.
Protein-protein interaction network visualization of modules identifies hub genes. Different colors represent the status of genes dysregulated, upregulated DEGs (red) and downregulated DEGs (green). The triangle nodes represent the hub genes in each module. The oval nodes represent genes and the lines represent interactions. DEGs, differentially expressed genes.

