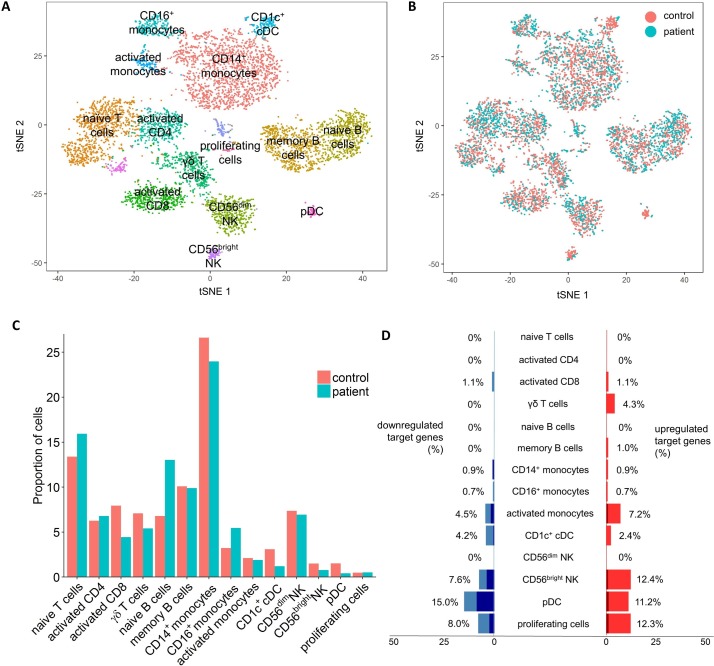
Figure 3.
Peripheral immune alterations with NFIL3 mutation. Integrated analysis of single cell sequencing transcriptomics data from patient and control PBMCs. (A) tSNE projection of 6908 PBMCs. After alignment, each cell is grouped into clusters (distinguished by colour). Single joint clustering revealed 14 immune populations annotated according to the expression of key lineage markers. (B) tSNE projection of 6908 PBMCs, split between patient and control after alignment. (C) Proportion of the total number of cells from each sample belonging to each leucocyte population. (D) Proportion of known NFIL3 target genes with a 2-fold (light blue/light red) or 4-fold (dark blue/dark red) expression change, within each leucocyte cluster. Only NFIL3 targets expressed within the cluster were considered. PBMCs, peripheral blood mononuclear cells.

