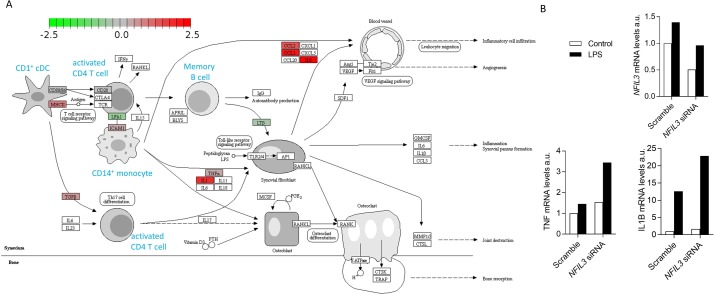
Figure 5.
Mapping of transcriptional changes in NFIL3 patient onto arthritogenic pathways. (A) Single cell sequencing transcriptomics data from patient and control PBMCs was mapped onto KEGG pathways. Transcriptional changes in the KEGG rheumatoid arthritis pathway were visualised using an adapted Pathview. In blue are shown labels for mapped cell types, corresponding to annotated single cell clusters. Differential gene expression within each annotated cell type is visualised with colour, with green indicating overexpression in healthy control and red indicating overexpression in patient. Synovial stromal cells, not present in the single cell RNAseq dataset, are represented but with annotated genes indicated as transcript not detected (white). (B) Healthy control PBMCs were differentiated into macrophages and treated with either scrambled siRNA or NFIL3 siRNA, and NFIL3 mRNA knockdown was confirmed by qPCR. Treated macrophages were stimulated with LPS for 24 hours, following which IL1β and TNFα mRNA expression was assessed by qPCR. PBMCs, peripheral blood mononuclear cells.

