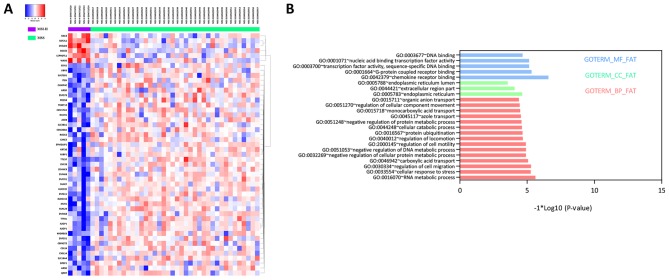
Figure 1.
Bidirectional clustering heat map of the DEGs between MSI-H and MSS samples and GO enrichment of DEGs. (A) A total of 49 DEGs were hierarchically clustered and illustrated, with six upregulated (red) and 43 downregulated (blue). (B) 15 BP terms, three CC terms and five MF terms were significantly enriched. DEGs, differentially expressed genes; MSS, microsatellite stable; MSI, microsatellite instability high; GO, Gene Ontology; BP, biological process; CC, cellular component; MF, molecular function. Red indicates upregulation and blue indicates downregulation.

