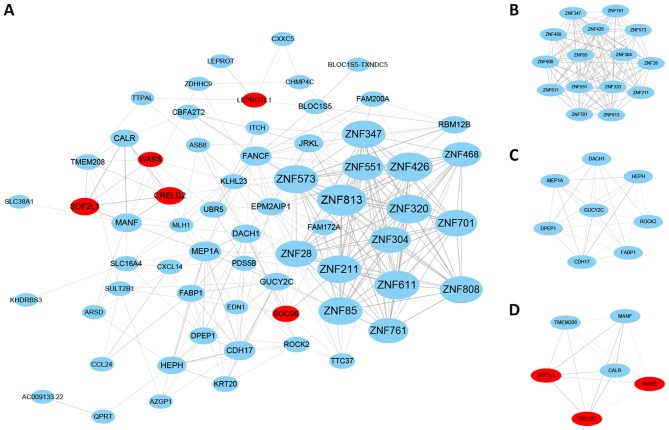
Figure 2.
Co-expression network constructed by the differentially expressed genes and additional correlated genes from the GeneMANIA program. (A) Co-expression network; (B) top modules with highest scores; (C) second highest module; (D) third highest module. Red indicates upregulation; blue indicates downregulation; lines between nodes indicates interactions between genes.

