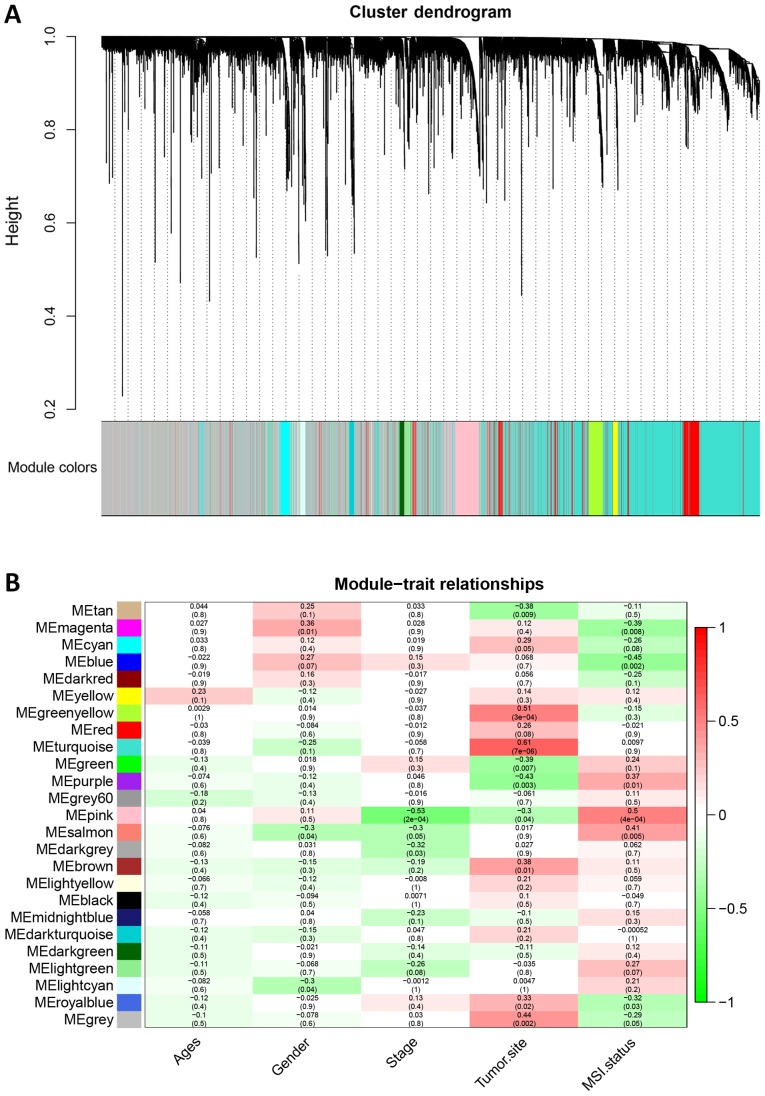
Figure 8.
Identification of 25 modules in weighted gene correlation network analysis with a heat map of the correlation between clinical traits and colored modules. (A) Clustering dendrogram of all genes between MSI and MSS. (B) Heat map of the correlation between modules eigengenes and clinical traits. Numbers in the cells indicate correlation (P-value in brackets). MSS, microsatellite stable; MSI, microsatellite instability. Red represents positive correlation and green represents negative correlation.

