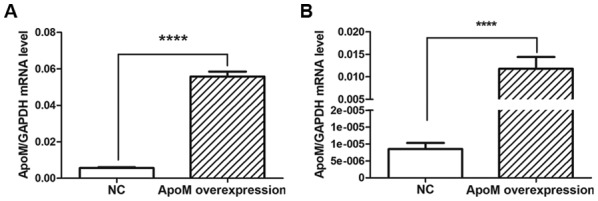
Figure 4.

ApoM transduction efficiency. ApoM mRNA expression levels in NC (infected with empty vectors) and overexpression groups (infected with apoM lentivirus vectors) in (A) Caco-2 and (B) EA.hy926 cells, as quantified using quantitative polymerase chain reaction. The mRNA expression levels of apoM were higher in the apoM overexpression group compared with in the NC group. ****P<0.0001 vs. NC. apoM, apolipoprotein M; NC, negative control.
