. 2019 Feb 15;36(1):Doc6. doi: 10.3205/zma001214

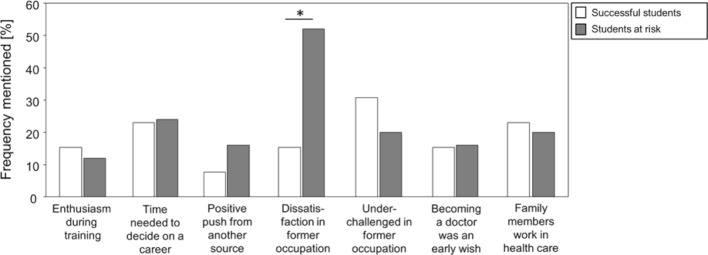
Figure 1. The bar graph shows the frequency of times the different reasons were cited for pursing the study of medicine. The light-colored bars represent the successful students who passed the first state exam (Physikum) within the standard number of semesters. The darker bars depict the at-risk students who either studied longer than the standard number of semesters before passing the first state exam or discontinued their medical studies. The asterisk indicates the statistically significant difference between successful and at-risk students in the identification of dissatisfaction with the former job. Fisher’s exact test was performed for the calculation.

Figure 1