Figure 4.

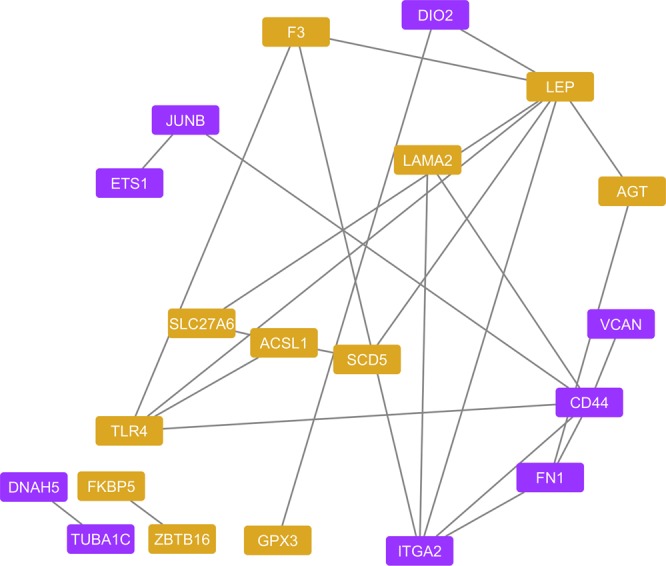
Predicted protein-protein interaction (PPI) network (p < 0.05) for genes differentially expressed over the course of the experiment (overall ACTH response). Upregulated and downregulated genes are shown in orange and purple, respectively.

Predicted protein-protein interaction (PPI) network (p < 0.05) for genes differentially expressed over the course of the experiment (overall ACTH response). Upregulated and downregulated genes are shown in orange and purple, respectively.