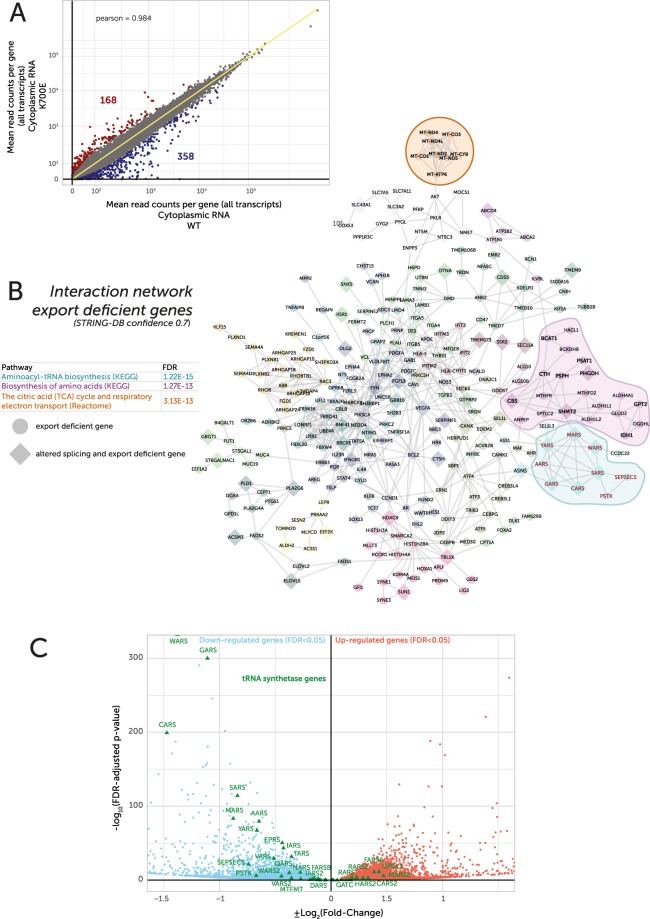
Figure 4.
(A) Scatter plot of mean cytoplasmic RNA-Seq read counts per gene, as normalised by DESeq2, comparing K700E cells to wildtype cells (n = 2). Axes plotted as biexponential (red = FDR < 0.05 FC > 2, blue = FDR < 0.05 & FC < −2). (B) Network of directly interacting proteins based on the set of genes identified as depleted in the cytoplasmic fraction of mutant cells (FDR0.05 FC < −1.5). Transcripts identified as having altered splicing in mutant cells are indicated as diamonds. Genes belonging to tRNA synthesis pathway (KEGG hsa00970) are labelled in red. Nodes coloured according to cluster assigned by Reactome FI. Protein-protein interactions identified by STRING-DB. Table lists top three enriched pathways for highlighted gene clusters and their FDR-adjusted p-values. (C) Plot of –log10(FDR-adjusted p-value) against log2(fold-change) for cytoplasmic RNAs WT vs SF3B1K700E –only log2(fold-change) ±1.5 shown (n = 2). Genes from tRNA synthetase pathway (KEGG hsa00970) plotted as green triangles. Significantly differentially-expressed tRNA synthetases are labelled.

