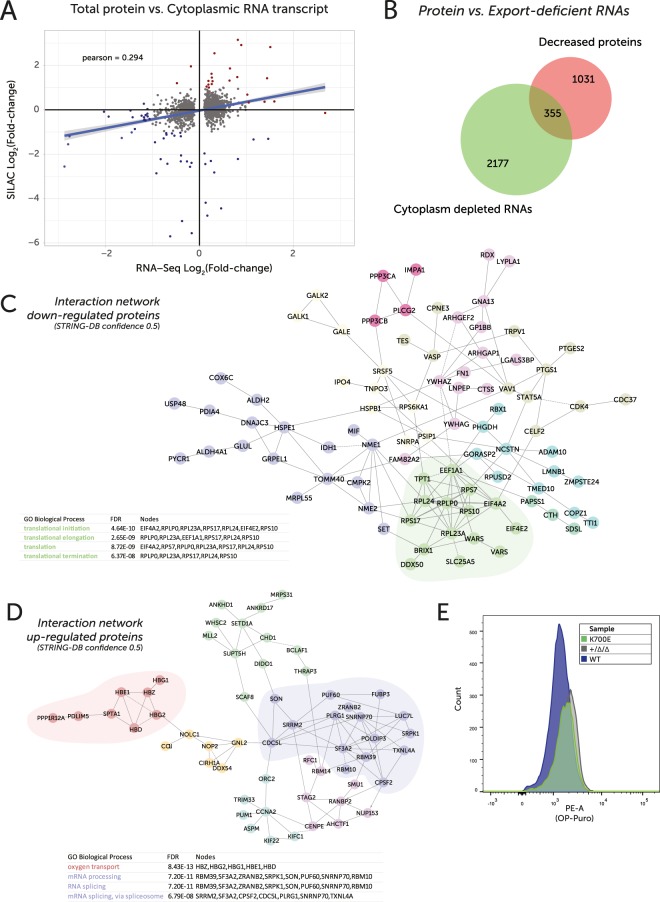
Figure 5.
(A) Scatter plot of log2-transformed protein fold change (SILAC, n = 1, 2702 unique protein hits passing QC) vs cytoplasmic transcript log2-transformed fold change (RNA-Seq - DESeq. 2, n = 2). Pearson correlation = +0.294. Red = FC > 2 | Blue = FC < −2 in both comparisons. (B) Venn diagram representing overlap in genes identified as being depleted in the cytoplasm (FDR < 0.05) and down at the protein level by SILAC, comparing SF3B1K700E vs wildtype samples. (C) Network of directly interacting proteins based on those identified as being decreased in the SF3B1K700E cells by SILAC. Nodes coloured according to cluster assigned by Reactome FI. PPIs identified by STRING-DB (direct, 0.5 confidence). Table identifies top 4 significantly enriched gene ontology terms from Reactome, all related to translation (green cluster). (D) Network of directly interacting proteins based on those identified as being increased in the K700E cells by SILAC. Nodes coloured according to cluster assigned by Reactome FI. PPIs identified by STRING-DB. Table identifies top 4 significantly enriched gene ontology terms from Reactome, including oxygen transport (red) and splicing (purple). (E) Flow cytometry histograms of cellular fluorescence representing OP-Puromycin (OP-Puro) uptake in wildtype, +/Δ/Δ and +/+/K700E cells.

