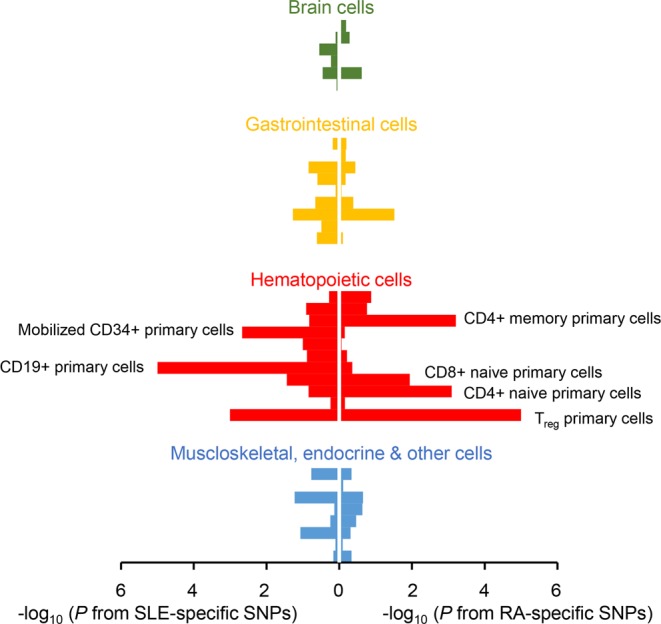
Figure 2.

Significant overlaps between cell type-specific H3K4me3 histone modification marks and disease-specific variants. Enrichment P values of RA- and SLE-specific variants within H3K4me3 marks were plotted for each cell type in a minus log10 scale. The x-axis represents the transformed enrichment P values for SLE variants (left) and RA variants (right). The bars for each cell type were colored according to the lineage classification of the cell type. The names of tissues with enrichment P values < 0.05 were labeled next to the corresponding bar. The detailed information of this figure is shown in Supplementary Table S4.
