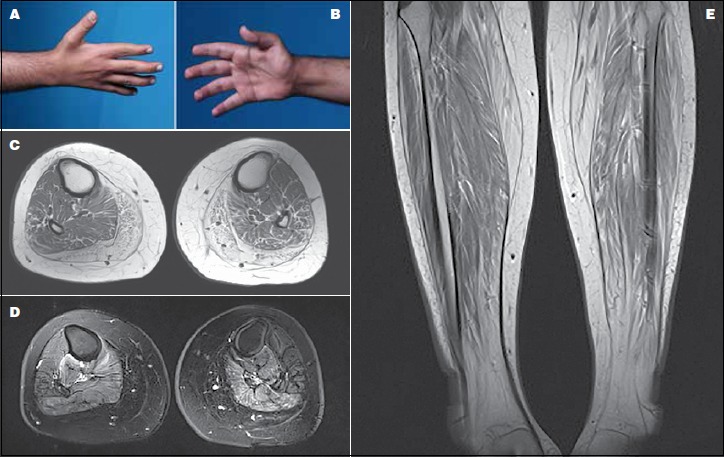
Figure 1.

(A-B) A photograph of the proband’s hand showing atrophy in the interossei (left) and thenar (right) muscle groups. (C) Axial T1-weighted MRI of the proximal leg showing selective involvement of the medial and posterior muscle groups with fatty infiltration. (D) Axial T2-weighted MRI of the mid-thigh depicting fiber changes in the posterior and medial muscle compartment. (E) Coronal STIR MRI of the proximal thighs demonstrating marked bilateral symmetrical increase signal intensity in the lateral compartment of the thigh consistent with fatty changes.
