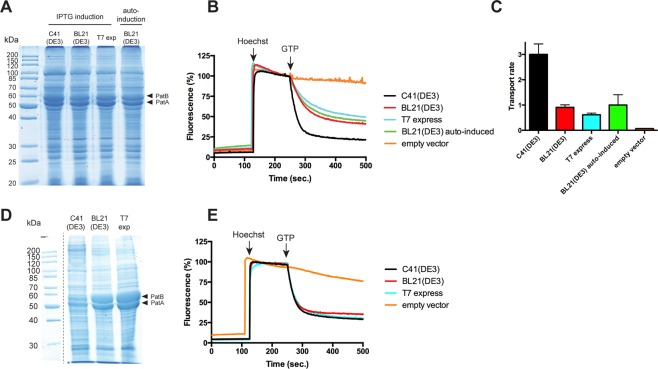
Figure 1.
Overexpression of PatA/PatB in various E. coli strains and functionality of the transporter. (A) Expression of the transporter was either induced overnight by IPTG when cells reached OD600~1.8 or by auto-induction. Membrane fractions were analyzed by 12% SDS-PAGE stained with Coomassie blue. Twenty µg of proteins were loaded in each lane. (B) Hoechst 33342 transport assays with inverted membrane vesicles prepared from the various strains in panel A. 50 µg of total membrane proteins were used for each sample. (C) Hoechst 33342 transport rates were measured by initial slopes following GTP addition. The empty vector was used in the C41(DE3) strain. The data represent the average of two independent experiments, each with triplicates, and error bars indicate the standard deviation. (D) Expression of the transporter was induced by IPTG in exponential phase for 5 h. Membrane fractions were analyzed by 12% SDS-PAGE stained with Coomassie blue. Twenty µg of proteins were loaded in each lane. Dash line delineates cropped images from different parts of the same gel. (E) Hoechst 33342 transport assays with inverted membrane vesicles prepared from the various strains in panel (D). The empty vector was used in the C41(DE3) strain. Two hundred µg of total membrane proteins were used for each assay. Data shown are representative of two independent experiments.

