
Fig. 2.
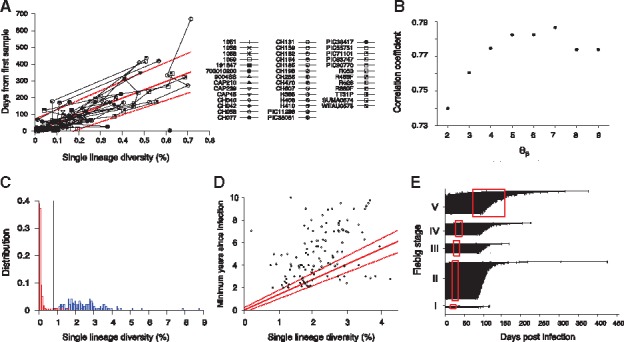
HIITE analysis of full envelope gene sequences. (A) Single lineage diversity dynamics of longitudinal incident specimens from 40 subjects in Supplementary Table S3, who were followed since their first sample, which was taken within 6 months of infection. To remove uncertainty in the timing of infection, the sampling time interval and increase in the single lineage diversity from each subject’s first sample were used. The best fit (solid red line) of the mixed-effects model to the single lineage diversity dynamics is presented along with the 95% prediction interval (dotted red lines). (B) Spearman correlation coefficient between the single lineage diversity difference and time difference for the 40 longitudinally followed subjects in Figure 2A. The correlation coefficient was maximal at 7. (C) With thresholds 7, 0.2, and 0.79, the single lineage diversity distributions of the 252 incident (red) and 144 chronic (blue) specimens resulted in a sensitivity of 96.0% and specificity of 99.3%. (D) The single lineage diversity of 144 chronic specimens is plotted along with each specimen’s minimum documented duration of infection. Around 85% of chronic specimens are located outside the 95% prediction interval in Figure 2A, violating the linear relationship between diversity and infection time. (E) HIITE estimated time since infection of Fiebig stage I–V samples. Among the 252 early infected subjects in Fiebig stages I–V, 12 subjects were misclassified as chronic and excluded. Each individual’s time since infection estimate (black circles), along with 95% prediction interval (black lines), is plotted against the 95% confidence interval for days post infection at each Fiebig stage (red boxes). Subjects at Fiebig stages I/II and II/III were grouped as II and III, respectively. The correlation between Fiebig stage and our estimate was statistically significant (Spearman’s correlation coefficient =0.44, P < 0.001) (Color version of this figure is available at Bioinformatics online.)