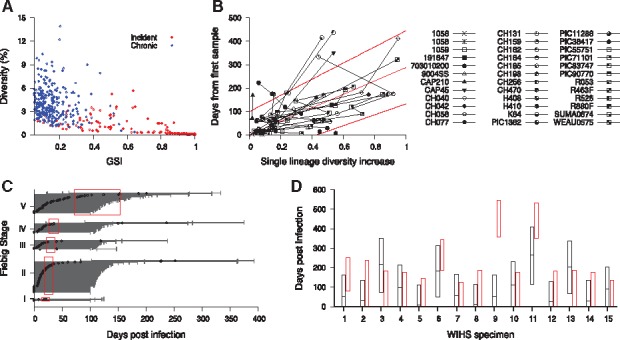
Fig. 3.

HIITE analysis of HXB2 7134-7499 segment sequences. (A) GSI and diversity of HXB2 7134-7499 segment specimens obtained from 283 incident and 297 chronic subjects in Supplementary Table S1 and S2. (B) Single lineage diversity increase and days from first sample for the 36 longitudinal subjects in Supplementary Table S3. The best fit (solid red line) of the mixed-effects model to the single lineage diversity dynamics is presented along with the 95% prediction interval (dotted red lines). (C) HIITE estimated time since infection of 223 Fiebig stage I–V samples. Each individual’s time since infection estimate (black circles) and its 95% prediction interval (black lines) are plotted against the 95% confidence interval for days post infection at each Fiebig stage (red boxes). The 95% prediction intervals of all but four specimens overlapped with Fiebig stage 95% confidence intervals. The correlation between Fiebig stage and our estimate was statistically significant (Spearman’s correlation coefficient =0.31, P < 0.001). (D) HIITE’s time since infection estimates (black horizontal lines) and 95% prediction intervals (black boxes) for 15 WIHS specimens classified as incident. The infection time intervals obtained from each specimen’s HIV-1 negative and positive test dates are plotted by red boxes. HIITE estimates overlapped with all specimens’ documented infection time intervals, except for specimen 9. WIHS specimen 1 is from subject TY2947, 2 from JG8930, 3 from JY3080, 4 from SS0342, 5 and 6 from RH7057, 7 from VE6375, 8 and 9 from EJ7211, 10 from TI9054, 11 and 12 from GE6106, 13 from OY9080, 14 from DA1342, and 15 from SI1392 (Supplementary Table S2) (Color version of this figure is available at Bioinformatics online.)
