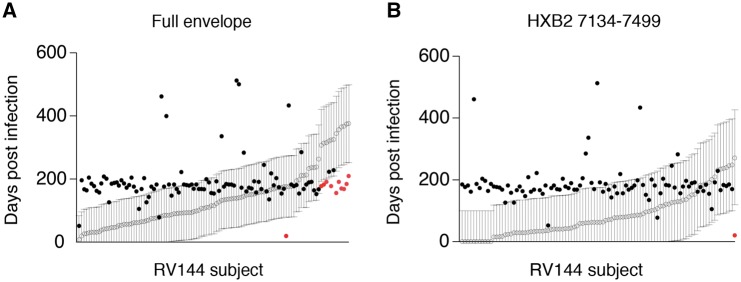
Fig. 4.
HIITE’s performance on vaccinated subjects and placebo recipients of RV144 vaccine trial. (A) HIITE estimated the time since infection (open circle) and 95% prediction interval (black line) for 109 RV144 trial participants who are denoted as incident by HIITE. Days from each subject’s HIV negative test date is marked by a filled black or red circle. Circles in red indicate cases which fell outside of the predicted interval. Out of the 109 subjects, 11 subjects’ 95% prediction interval was located outside each subject’s documented maximum duration of infection (marked by red dots). (B) The segment HXB2 7134-7499-based estimates on time since infection (open circle) with 95% prediction interval (black line) for the 96 RV144 vaccine trial participants HIITE classified as incident. Each subject’s days from last HIV-1 negative sample is denoted by a filled circle (Color version of this figure is available at Bioinformatics online.)

