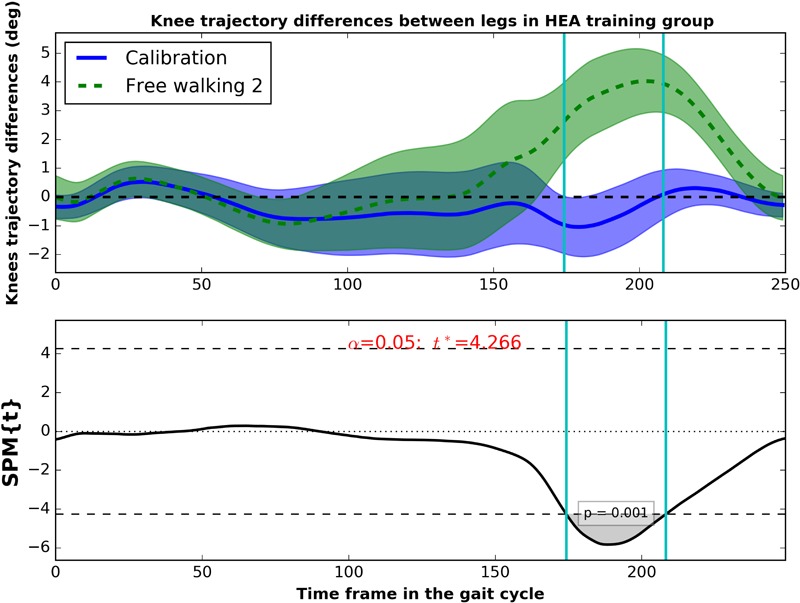
FIGURE 8.

(Up) Mean trajectory of the knee angle differences during Calibration (solid blue) and free walking 2 (dashed green) from the HEA group. Clouds represent the standard error. (Bottom) SPM{t} statistic for the paired t-test (knee differences between Calibration and free walking 2) in the HEA group. Vertical cyan lines indicate starting and finishing points of the supra-threshold cluster in the test.
