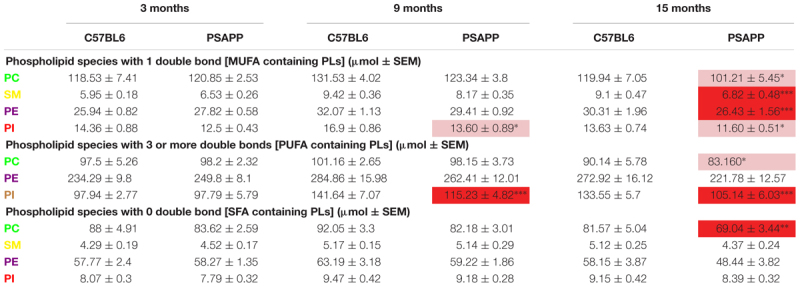
Table 6.
Classification of phospholipid species based on the number of double bonds (degree of fatty acid saturation) in the cortex of PSAPP mice.
 |
Significant changes in PC, SM, PE, and PI species with ‘0’, ‘1’ or ‘3 or more’ double bonds in the cortex of an AD mouse model. Sample size for all groups across all time points is n = 4. All data represents mean μM per (10 mg) wet weight ± SEM. Individual molecular lipid species were quantified by LC/MS and were summed after LipidomeDB analyses to generate degree of fatty acid classification for each phospholipid species. Red color code indicates a decrease in lipid species. Asterisks represents ∗P < 0.05 (lightest shade of red); ∗∗P < 0.01 (middle shade of red); ∗∗∗P < 0.001 (darkest shade of red) for comparisons between PSAPP/WT mice. PE, Phosphatidylethanolamine; LPE, Lysophosphatidylethanolamine; PC, Phosphatidylcholine; LPC, Lysophosphatidylcholine; PI, Phosphatidylinositol; SM, Sphingomyelin.
