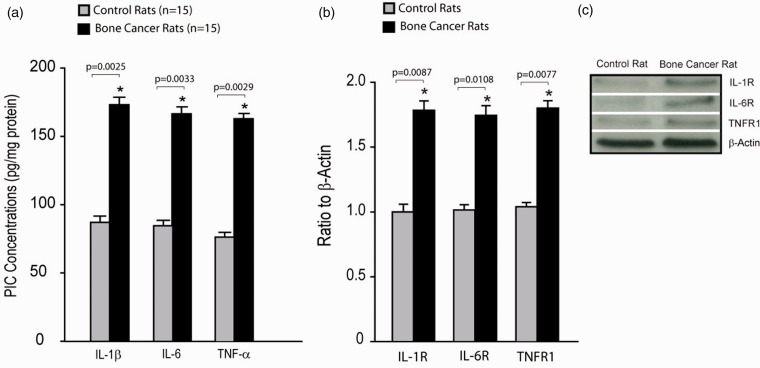
Figure 3.
PIC levels and PIC receptor expression. (a) The levels of PICs were increased in the dl-PAG of bone cancer rats as compared with control rats (n = 15 in each group). *P < 0.01 versus control rats. P values are also shown. (b and c) Averaged data and typical bands showing the protein expression of PIC receptors (IL-1R, IL-6R, and TNFR1) in the dl-PAG. The expression levels of membrane PIC receptor were amplified in the PAG of bone cancer rats. *P < 0.01 versus control rats. The number of animals = 8–12 in each group. P values are also shown. PIC: pro-inflammatory cytokine; IL: interleukin; TNF: tumor necrosis factor; TNFR1: tumor necrosis factor receptor 1.

