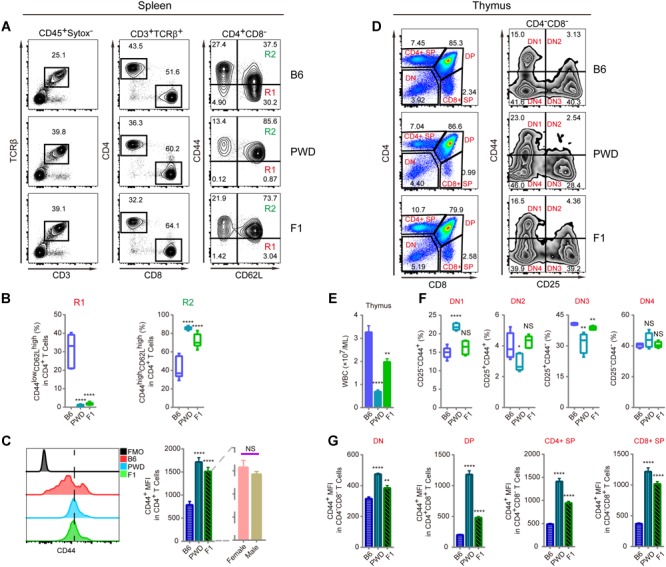
FIGURE 2.

T cell phenotyping of B6, PWD and F1 mice for spleen and thymus. For peripheral T cell analysis, splenocytes were analyzed ex vivo for CD44 and CD62L expression in CD4 T cells. For thymocytes analysis, CD4 and CD8 T single positive T cells and their precursors namely CD4 and CD8 double positive and double negative cells were analyzed. Inside the double negative compartment, further analysis with CD25 and CD44 were used to define each precursor population. (A) The gating method for T cells in the spleen of B6, PWD and F1 mice. (B) Frequency of CD44lowCD62Lhigh cells (R1) and CD44highCD62Lhigh cells (R2) in CD4+CD8- cells of B6, PWD and F1 splenocytes. (C) Overlay of CD44 MFI in CD4 T cells of B6, PWD and F1 splenocytes, FMO control was used as negative control by staining all the surface labeling antibodies except CD44. (D) The gating method for immune cells in the thymus of B6, PWD and F1 mice. (E) Absolute thymocyte count of B6, PWD and F1 mice. (F) Frequency of DN1-DN4 cells in DN cells of B6, PWD and F1 thymocytes. (G) MFI of CD44 positive cells in DN, DP, CD4+ SP and CD8+ SP cells of B6, PWD and F1 thymocytes. Representative FACS data were from two independent experiments involving at least seven animals for each group of mice. Data were analyzed by two-tailed Student’s t-test. Data were presented as Mean ± SEM. ∗∗p < 0.01, ∗∗∗∗p < 0.0001.
