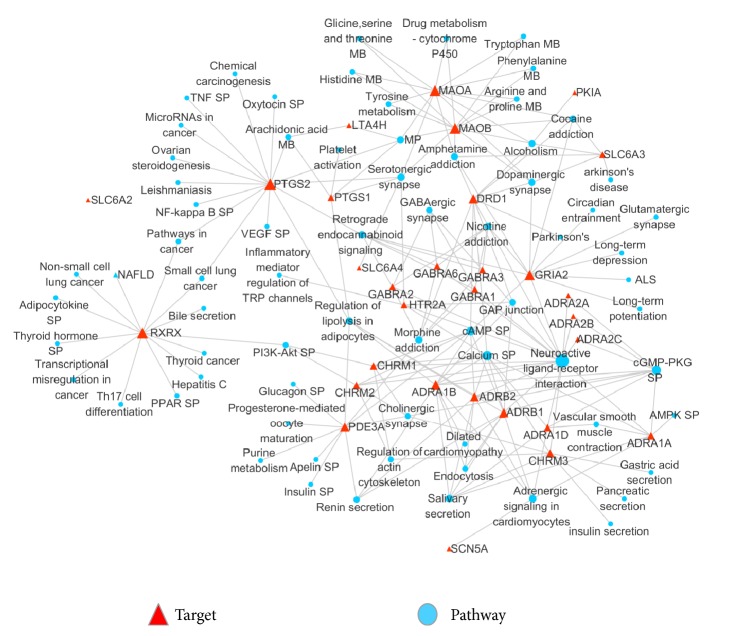
Figure 4.
Target-pathway network analyses results. The red triangle nodes represented the targets while the blue circle nodes represented the pathways. The target proteins were linked with their corresponding pathways. Nodes sizes were proportional to their degrees (abbreviations: SP: signaling pathway; MB: metabolism; NAFLD: nonalcoholic fatty liver disease; and ALS: amyotrophic lateral sclerosis.).

