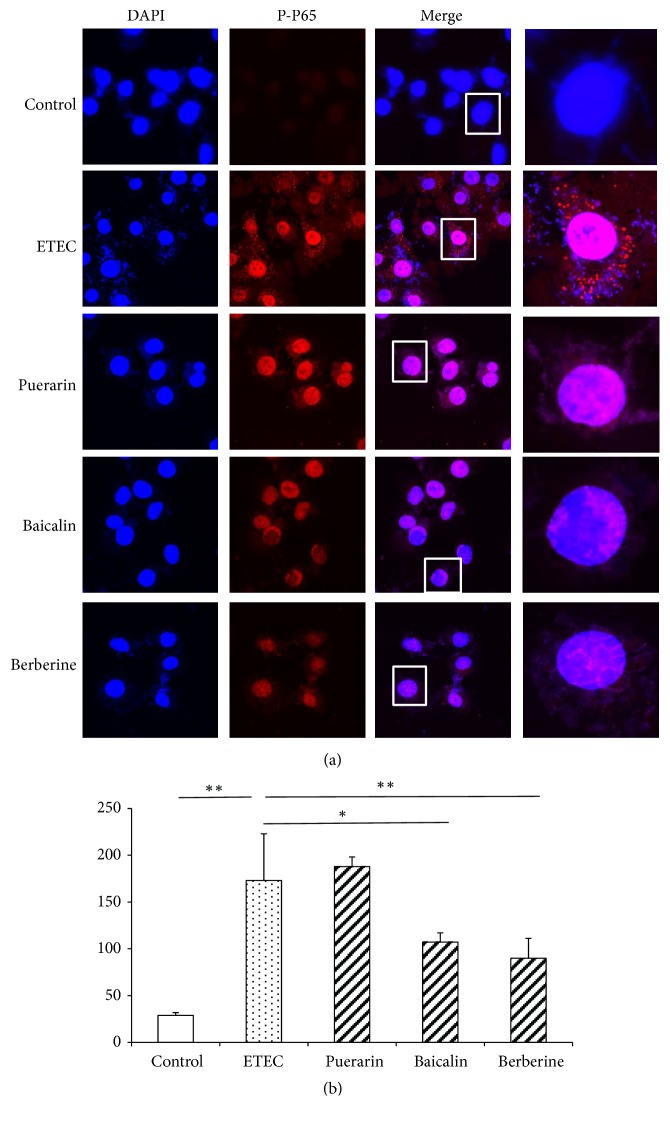
Figure 9.
Confocal microscopy of IPEC-J2 cells and quantification of fluorescence intensities of P-P65 in the nucleus. (a) Confocal microscopy of IPEC-J2 cells. The cells were stained for the nucleus (blue) and the protein P-P65 (red). Top row: untreated IPEC-J2 cells; second row: treatment with ETEC for 3 h; third row: pretreatment with puerarin 200 μg/mL + ETEC; fourth row: pretreatment with baicalin 1 μg/mL + ETEC; bottom row: pretreatment with berberine hydrochloride 100 μg/mL + ETEC. Bar scale represents 10 μm. (b) Quantification of fluorescence intensities of P-P65 in the nucleus. ETEC infection increased P-P65 protein expression in the nucleus. Relative to the ETEC infection group alone, pretreatment with baicalin and berberine hydrochloride significantly decreased P-P65 protein expression in the nucleus. Control: untreated cells; ETEC: treatment with ETEC for 3 h; puerarin: pretreatment with puerarin at 200 μg/mL + ETEC; baicalin: pretreatment with baicalin at 1 μg/mL + ETEC; berberine: pretreatment with berberine hydrochloride at 100 μg/mL + ETEC. Data are mean ± SEM, n = 6 per treatment (∗P < 0.05; ∗∗P < 0.01).

