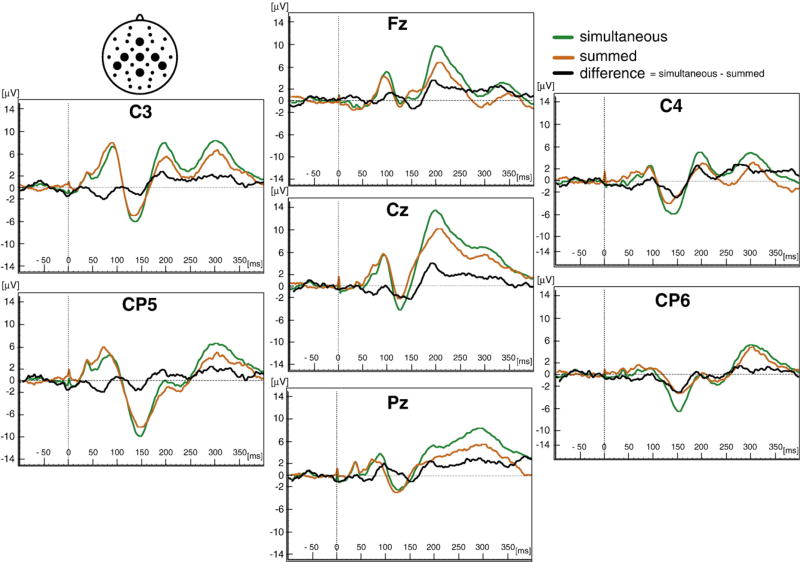
Fig. 3.
Auditory–somatosensory multisensory integration (MSI). The grand averages of ERPs for 21 children are shown for the seven electrode sites (Fz, Cz Pz, C3, CP5, C4 and CP6) designated in the schematic in the upper left-hand corner. Simultaneous auditory and somatosensory ERPs (green traces) are compared to the sum of unisensory auditory added to unisensory somatosensory ERPs (orange traces). Difference waves (black traces = simultaneous – summed) identify possible scalp locations for MSI.

