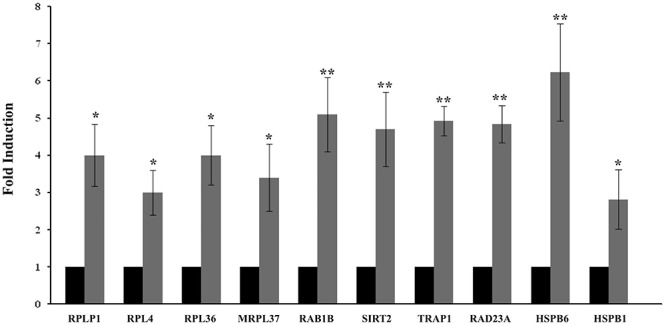
Figure 3.

Quantitative expression analysis of representative messengers evidenced by IPA analysis in the skeletal muscle from CG and VPG subjects. Quantitative analysis expression (RTqPCR) of RPLP1, RPL4, RPL36, MRPL37, RAB1B, SIRT2, TRAP1, RAD23A, HSPB6, and HSPB1 messenger expression was determined in skeletal muscle biopsies from 15 CG (black bars) to15 VPG subjects (gray bars). An arbitrary value of 1 was assigned to the expression of each messenger in CG. Data represent the means (±SEM) of three different experiments; data were compared using one-way ANOVA and differences were considered significant at ∗p < 0.05 and ∗∗p < 0.01 compared to CG.
