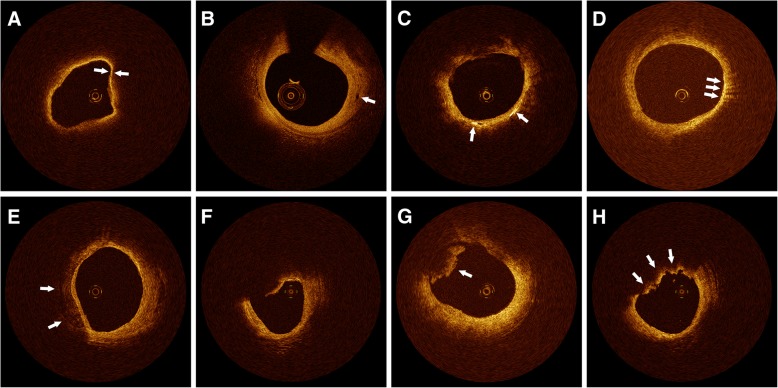
Fig. 2.
Representative optical coherence tomography images. a TCFA, defined as a lipid-rich plaque with a fibrous cap thickness < 65 μm (arrows). b Microvessels are represented by black holes within the plaque (arrow). c Cholesterol crystals are reflected by thin, linear regions of high intensity within the plaque (arrows). d Macrophage accumulation on OCT images, defined as increased signal intensity within the fibrous cap, accompanied by heterogeneous backward shadows (arrows). e Calcification is reflected by an area with low backscatter signal and a sharp border (arrows). f Plaque disruption showing discontinuity of the fibrous cap. g White (platelet-rich) thrombus is represented by low and homogeneous backscattering with low signal attenuation (arrow). h Red (red blood cell-rich) thrombus is represented by high backscattering with high attenuation (arrows)

