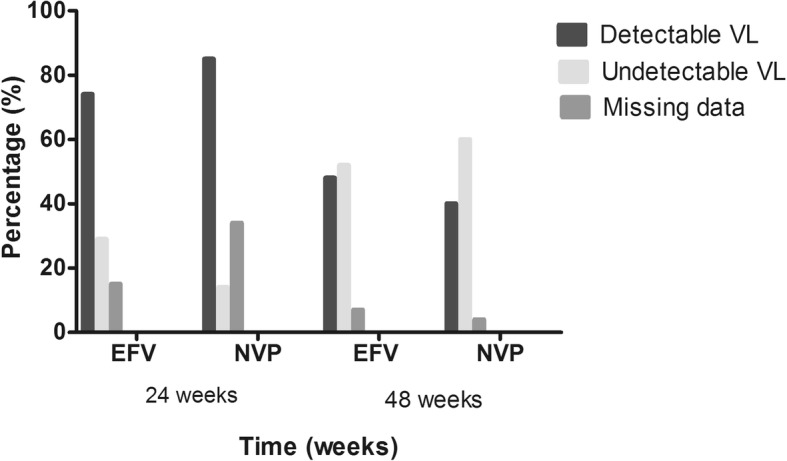
Fig. 3.

HIV-load suppression at 24 and 48 weeks. The level of viral load < 40 copies/ml and > 40 copies are represented as undetectable and detectable viral load levels in the chart. Each bar represents the percentage of undetectable and detectable viral load levels in both regimens at 24 and 48 weeks of treatment
