FIGURE 3.

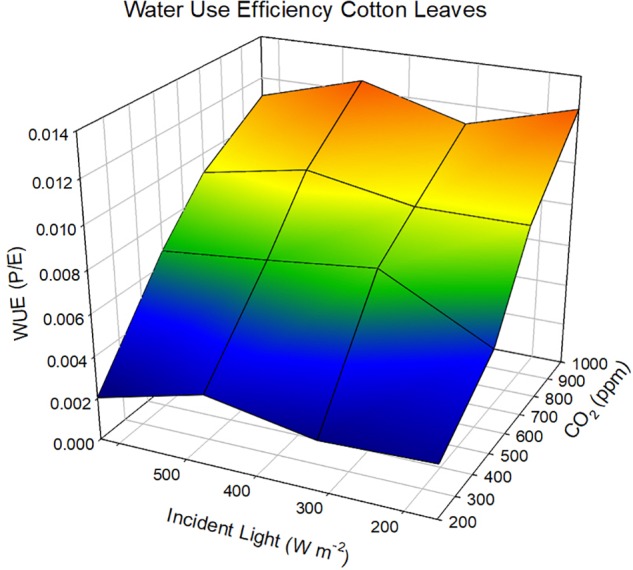
Response of water use efficiency in cotton leaves as a function of changing CO2 and incident light levels at a constant wind speed of 2.4 cm sec-1. Data redrawn from Bierhuizen and Slatyer (1965).

Response of water use efficiency in cotton leaves as a function of changing CO2 and incident light levels at a constant wind speed of 2.4 cm sec-1. Data redrawn from Bierhuizen and Slatyer (1965).