FIGURE 4.

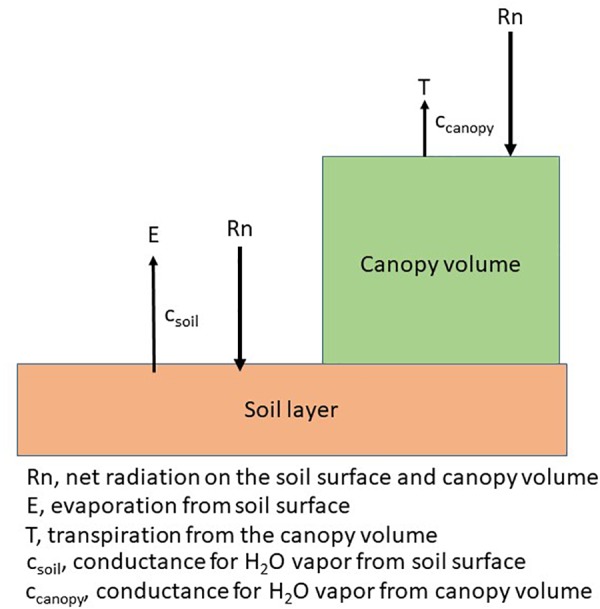
Schematic of the energy distribution on the plant and soil surface and the canopy level conductances for a canopy arranged in rows.

Schematic of the energy distribution on the plant and soil surface and the canopy level conductances for a canopy arranged in rows.