
Fig. 5.
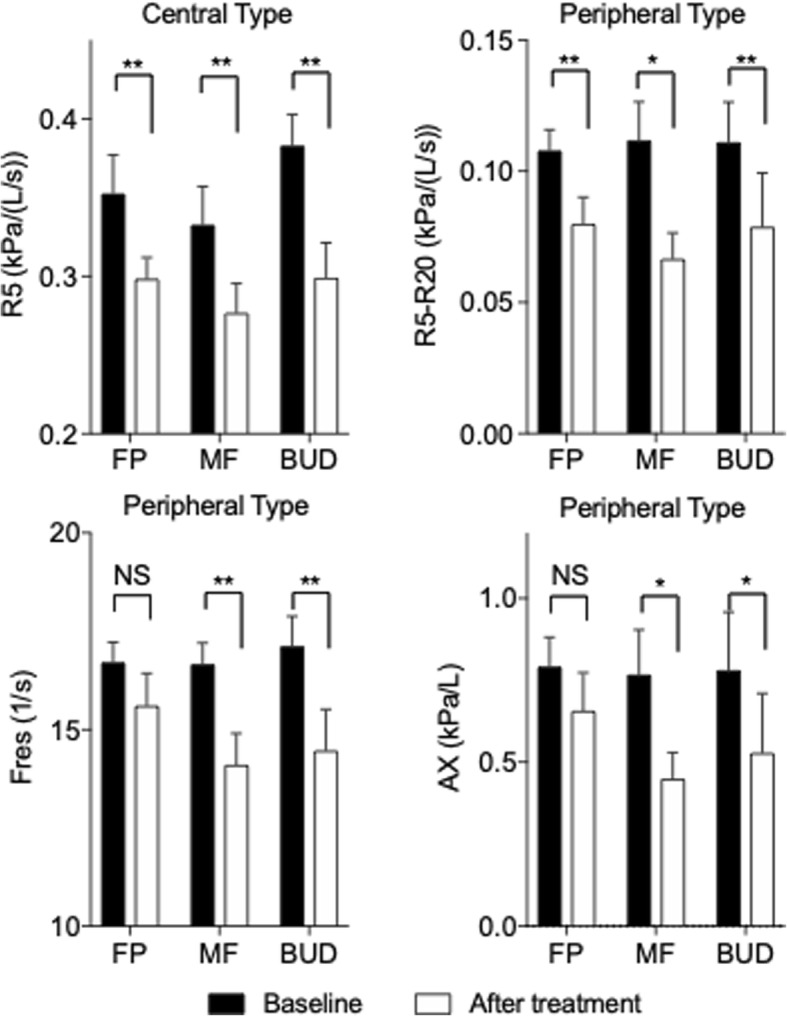
Comparison of IOS index in the ICS therapy groups in the central type and peripheral type at the baseline and after treatment. Bars are expressed as the mean ± SEM. Refer to Additional file 1: Table S2 for the original data. Differences between the baseline and after treatment were tested by a paired t-test. *: p < .05, **: p < .01, NS; not significant