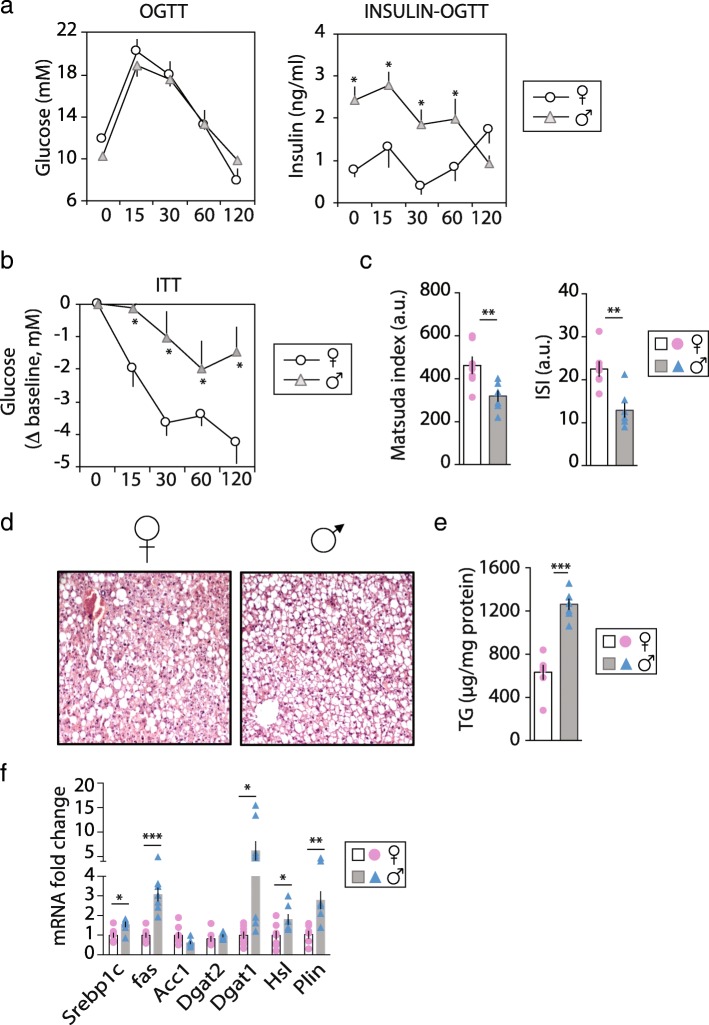
Fig. 1.
Sex-dependent fat distribution and metabolic response to weight gain. Ob/ob female (F) (♀ open bars and pink bullets) and male (M) (♂ gray bars and blue triangles) mice fed a chow diet for 5 weeks. Blood (a) glucose and serum insulin levels during the oral glucose tolerance test (OGTT); b delta blood glucose level from baseline (T0) during the insulin tolerance test (ITT); c matsuda index was used as a measure of whole body insulin sensitivity and ISI as an index of hepatic insulin sensitivity (n = 7); d representative hepatic histological sections stained for hematoxylin and eosin (n = 4); e liver triglycerides (TG) level (n = 7); f expression levels of de novo lipogenesis (Srebp1c, Fas Acc1) and triglycerides synthesis (Dgat1 and Dgat2) genes. Values are mean ± sem, n = 6–9; (P < 0.05)*, M vs F. Abbreviations: Srebp sterol regulatory binding transcription factor, Fas fatty acid synthase, Acc1 acetyl-CoA carboxylase, Dgat diacylglycerol O-acyltransferase, Hsl hormone sensitive lipase and Plin perilipin

