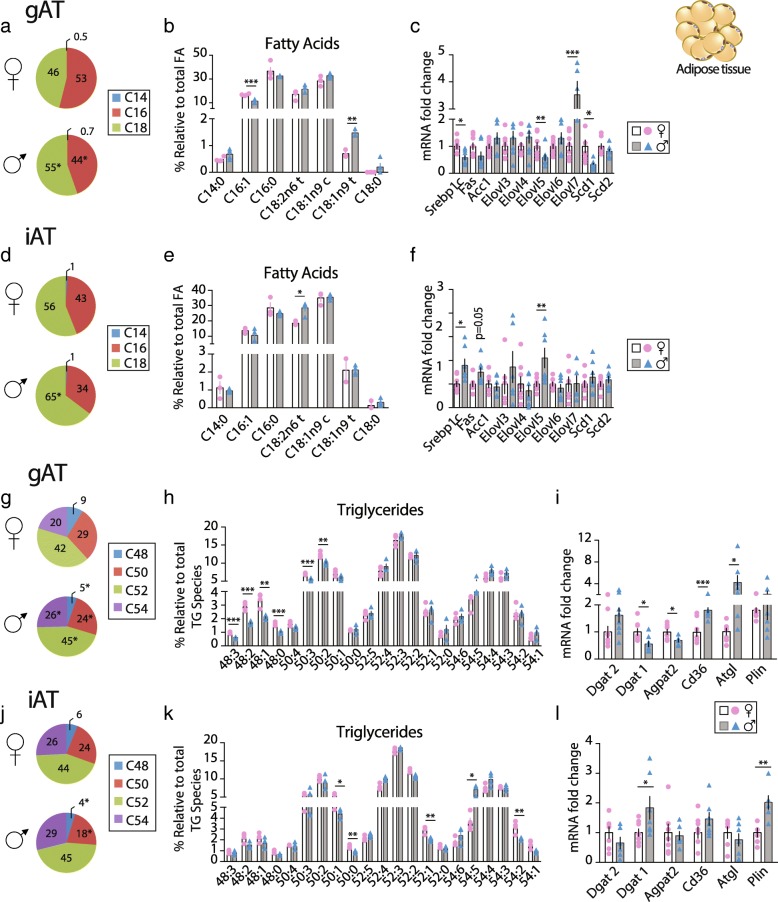
Fig. 4.
Sex-dependent FA and TG species in gAT and iAT. Sex-dependent gAT and iAT FA and TG profiles in ob/ob F (♀ - open bars and pink bullets) and M (♂ - gray bars and blue triangles) mice. Pie charts in a gAT and d iAT presenting the relative content of C14, C16 and C18 FA species; Relative quantification, in b gAT and e iAT, of the most abundant FAs found by lipidomic analysis (n = 4); Relative expression levels in c gAT and f iAT of de novo fatty acid synthesis genes (n = 7–9); Pie charts in g gAT and j iAT presenting the relative content of TG species; Relative quantification, in h gAT and k iAT, of the most abundant TGs found by lipidomic analysis (n = 4) and; Relative expression levels in i gAT and l iAT of the genes Dgat2, Dgat1, Agpta2, Cd36, Atgl and Plin (n = 7–9). Values are presented as mean ± sem; *, P < 0.05, **, P < 0.01 and ***, P < 0.001 M vs F were considered significant. Abbreviations: gAT: gonadal adipose tissue, iAT: inguinal adipose tissue, Elovl: fatty acid elongase, Scd: fatty acid desaturase, Srebp: sterol regulatory binding transcription factor, Fas: fatty acid synthase, Acc: acetyl-CoA carboxylase, Dgat: diacylglycerol O-acyltransferase, Agpat2: 1-acylglycerol-3-phosphate-O-acyltransferase 2, Cd36: cluster of differentiation 36, Atgl: adipose triglyceride lipase and Plin: perilipin

