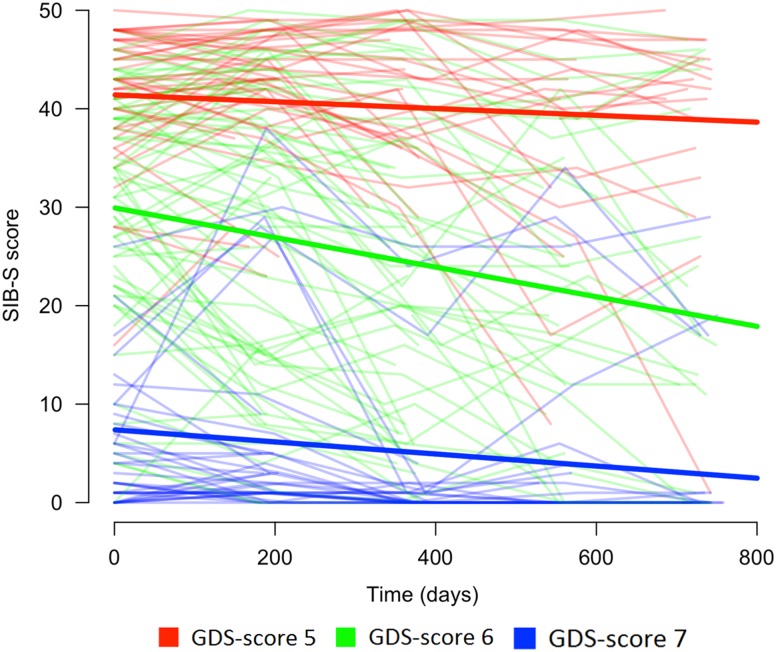
Fig. 1.
Course of SIB-S scores over time for persons with moderate to severe dementia according to dementia stage (without a correction for age). The bold lines represent the mean course of SIB-S scores per GDS-score and the thin lines represent the course of SIB-S scores for each individual participant.

