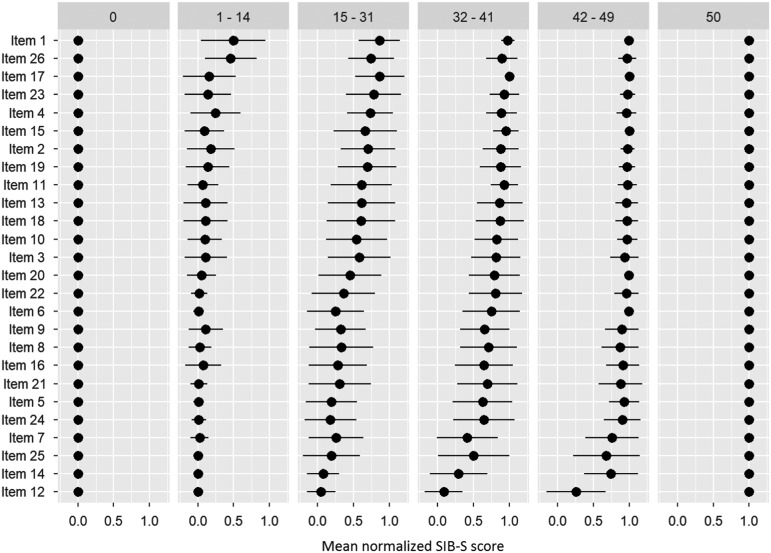
Fig. 3.
Ranking of the items by how many participants could still successfully complete the item per group (classified by total SIB-S score). The ranking was based on the whole population. As a measure for the item’s completion rate, per item the mean normalized SIB-S score was calculated per group. The mean normalized SIB-S score was calculated by taking the average (represented by bullets) and associated standard deviation (represented by lines) over all participants within one group.

