An official website of the United States government
Here's how you know
Official websites use .gov
A
.gov website belongs to an official
government organization in the United States.
Secure .gov websites use HTTPS
A lock (
) or https:// means you've safely
connected to the .gov website. Share sensitive
information only on official, secure websites.

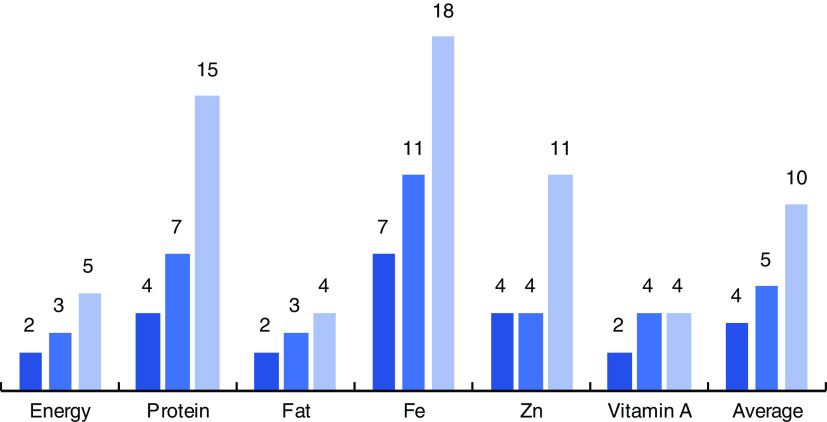
 ,70 %;
  , 80 %;
  , 90 %), by nutrient, among 6374 rural Bangladeshi households using data from the 2011/12 Bangladesh Integrated Household Survey (BIHS)