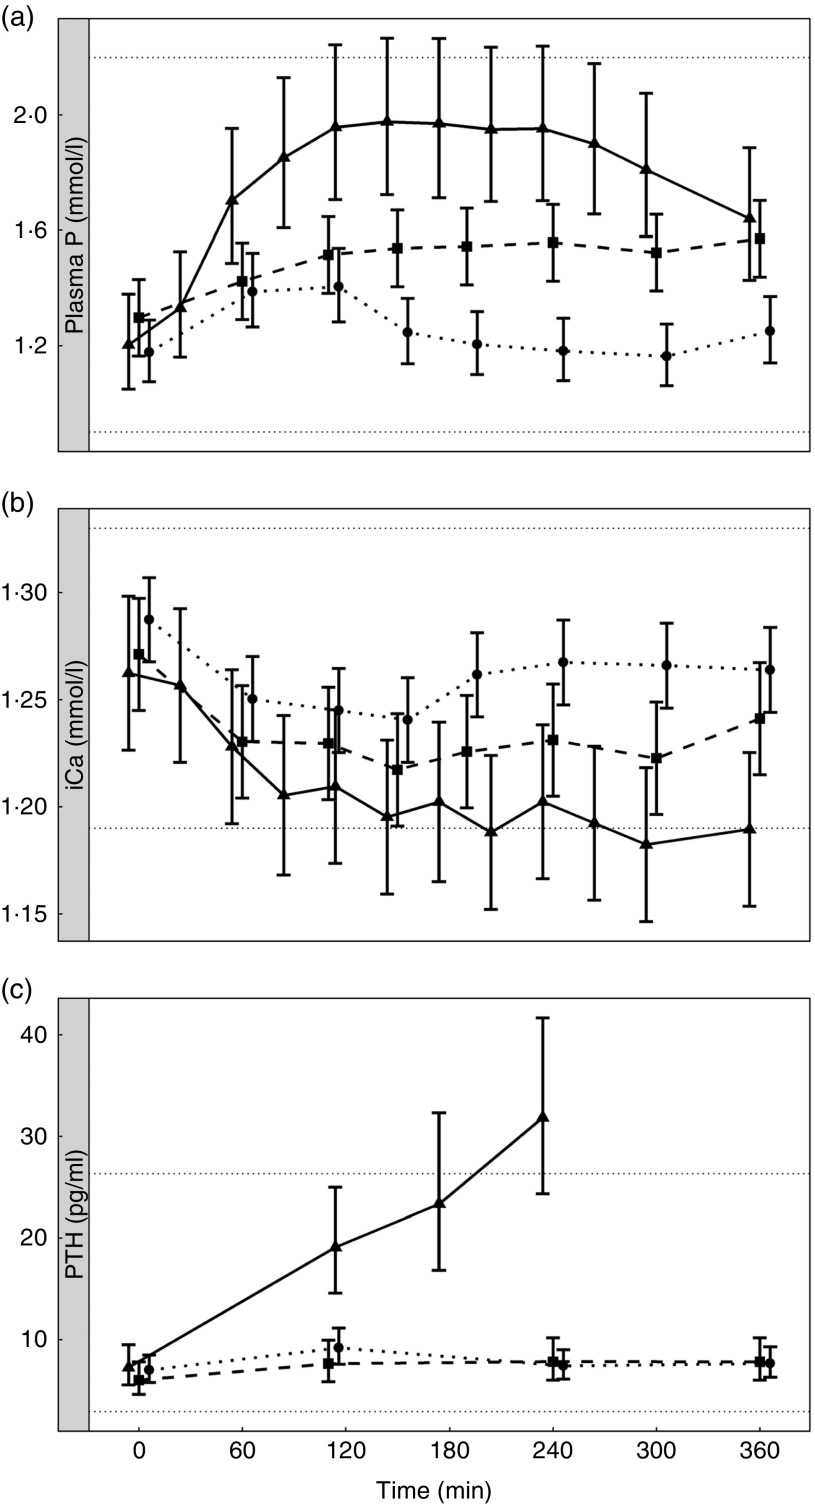
Fig. 9.
Postprandial biochemical parameters to enable a visual comparison of diet A from study 1 ( ), diet I from study 3 (
 ) and diet K from study 4 (
 ). (a) Plasma phosphorus, (b) ionised calcium (iCa) and (c) parathyroid hormone (PTH). Diet A: 4·8 g total phosphorus/4184 kJ (1000 kcal), 3·5 g P from dihydrogen phosphate (SDHP)/4184 kJ (1000 kcal), calcium:phosphorus 0·56. Diet I: 3·86 g total phosphorus/4184 kJ (1000 kcal), 1·5 g phosphorus from SDHP/4184 kJ (1000 kcal), calcium:phosphorus 1·59. Diet K: 3·59 g total phosphorus/4184 kJ (1000 kcal), 1·5 g phosphorus from SDHP/4184 kJ (1000 kcal), calcium:phosphorus 0·93. Reference ranges are shown for each parameter.

