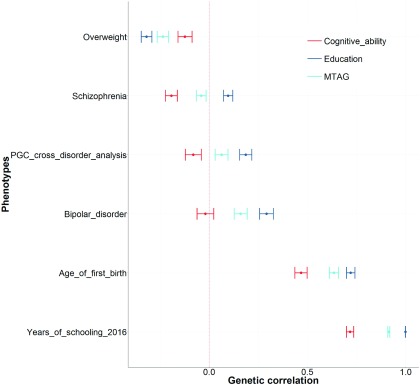
FIGURE 1.
An empirical comparison between the genetic correlations produced using the three cognitive phenotypes from Lam et al. (2017). First, genetic correlations were selected when there was at least one nominally significant genetic correlation with any one of the three cognitive phenotypes used in Lam et al. Second, we show that for those traits, there were only six instances where the MTAG phenotype was significantly different from the education phenotype. However, in each of these six instances, the MTAG phenotype was also significantly different from the cognitive ability phenotype. Each point represents a genetic correlation between one of the three cognitive phenotypes (red = cognitive ability, dark blue = education, and light blue = the MTAG phenotype described as trait specific to cognitive ability by Lam et al. (2017)) and the traits presented on the y-axis. The dotted red line indicates a genetic correlation of zero. Error bars represent ±1 standard error as derived using LDSC regression.

