Figure 2.
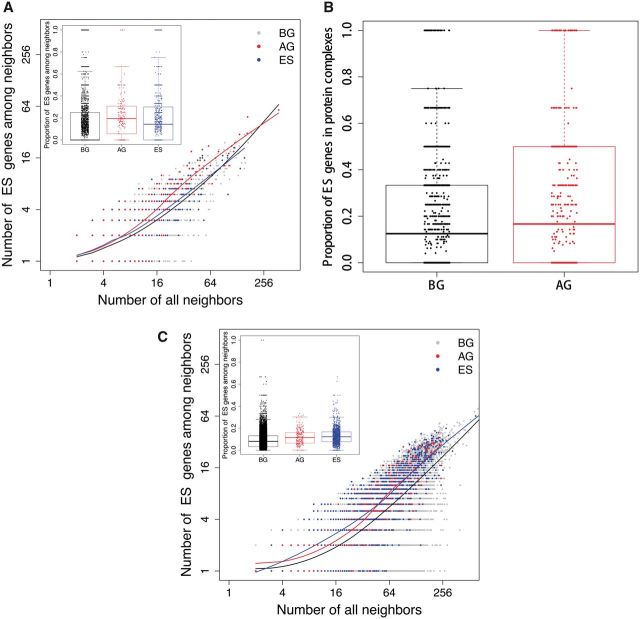
Network association between aging and essential genes. (A) Association in the PPI network. Also shown are regression lines based on a weighted local fitting model (20) using log2(the number of neighbors + 1). Only non-essential aging genes are included in this analysis. Essential genes are more enriched in the neighborhood of aging genes than in the neighborhood of background genes (P = 2.231 × 10⁻¹¹, Wilcoxon rank sum test) or even essential genes themselves (P = 9.318 × 10⁻⁴). (B) Association in protein co-complexes. Due to their enrichment for essential genes, aging genes were not included in the calculation of the proportion of essential genes in the co-complexes. Essential genes are enriched in the aging co-complexes compare to that in all co-complexes (P = 6.405 × 10⁻³). (C) Association in the coexpression network. Only non-essential aging genes are included in the analysis. Aging genes are more likely to co-express with essential genes (P = 4.848 × 10⁻¹²). BG, background genes; AG, aging genes; ES, essential genes.

