Figure 5.
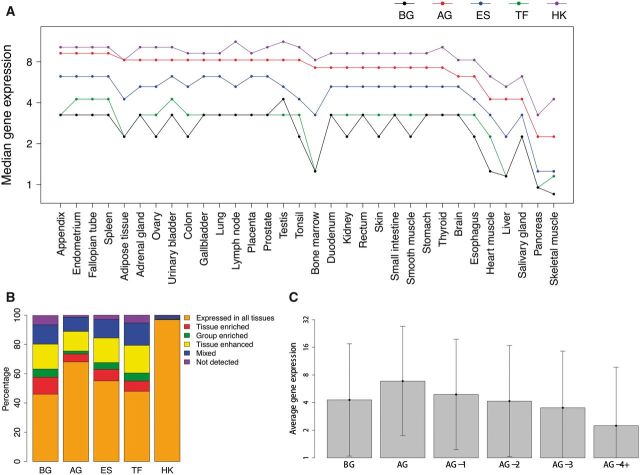
Expression profiles of gene sets across 32 human tissues. (A) Gene expression levels across 32 tissues. Gene expression was measured in FPKM (plus a pseudo count of 0.25). The tissues are ordered according to the median express levels of aging genes. Although aging genes have lower expression levels than housekeeping genes, they tend to have statistically significant higher expression levels than background (i.e. protein coding genes), essential, and transcription factor genes across all 32 tissues (P < 0.05 in all tissues by Wilcoxon rank sum test). (B) Composition of genes categories with different tissue specificity in each gene set. (C) Gene expression and the distance to aging genes in the PPI network (showing the mean and one standard deviation). Log2-transformed FPKM (plus a pseudo count of 0.25) values were used in this analysis. Here, background genes are all the genes in the PPI network; AG-1 are direct neighbors of aging genes; AG-2, genes two steps away from the aging genes; AG-3, genes three steps away from aging genes; AG-4+, genes four and more steps away from the aging genes. As their distance to aging genes increases, genes tend to have lower average expression levels across tissues (P < 0.01, Wilcoxon rank sum test). BG, background genes; AG, aging genes; ES, essential genes; TF, transcription factor genes; HK, housekeeping genes.

