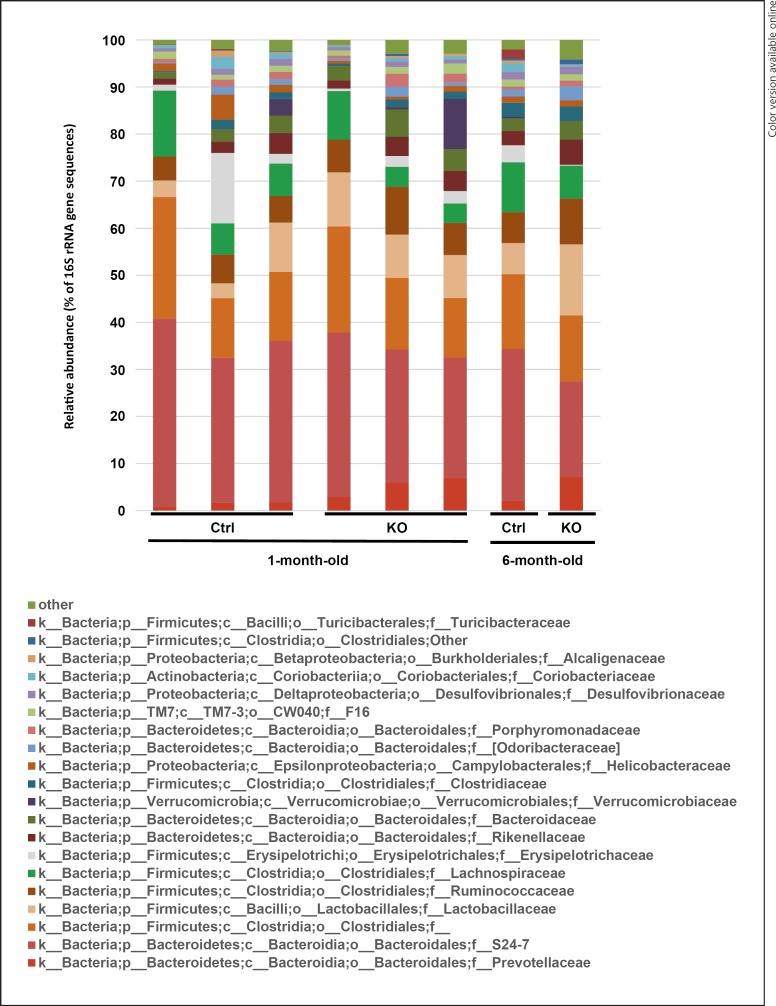
Fig. 1.
Relative abundance of bacterial family composition in the pooled feces. SOCS1–/–Tg (KO) and SOCS1+/+Tg (control) mice were analyzed at 1 month and 6 months of age. Stacked columns represent the abundance of a given family as a percentage of the total bacterial sequences in the pooled sample derived from 2–6 mice. Each stacked column represents pooled fecal samples from 2–6 mice per group. The 20 most representative families are shown.

