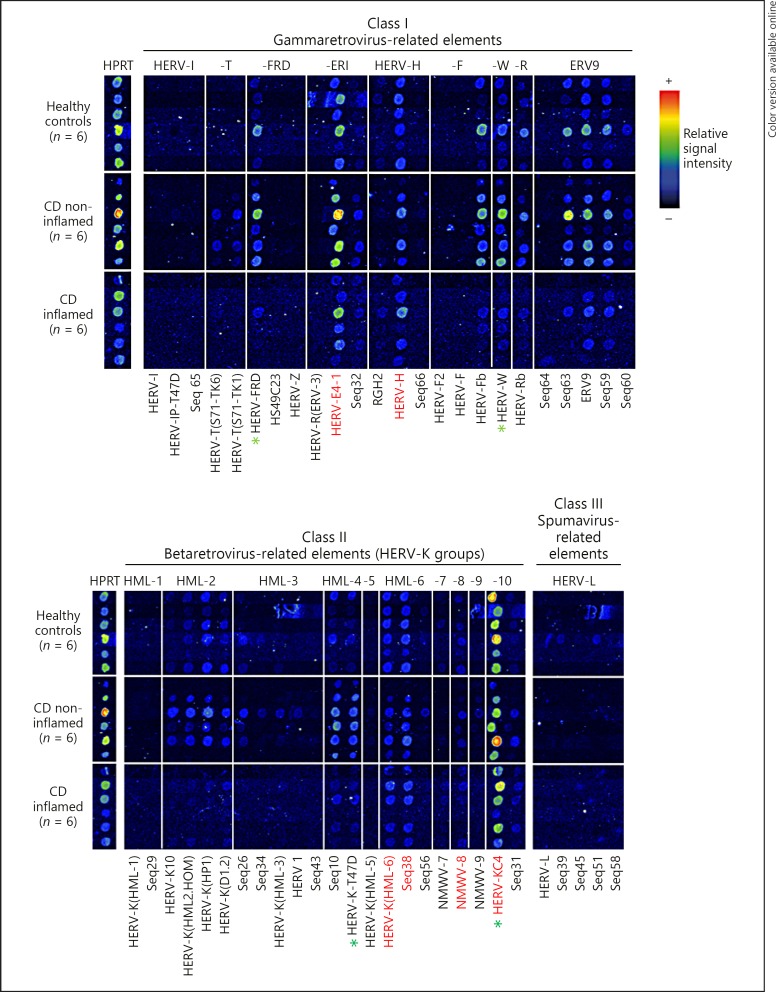
Fig. 1.
RetroArray analysis of HERV expression patterns in colonic tissue. The digitally aligned HERV activity profiles represent samples of 6 different individuals per investigated group (healthy controls; inflamed Crohn's disease [CD]; non-inflamed CD). HERV subgroups defining the colonic core signature (irrespective of disease or inflammation state) are emphasized with red letters. HPRT served as housekeeping gene for internal control. Although false colour mapping was used for improved image visualization, weak signals may be unrecognizable in the figure. Core transcription pattern was therefore confirmed by densitometry (data not shown). Green asterisks highlight HERV subgroups showing the most prominent differences between healthy controls and CD (qualitatively and in densitometry [also see Fig. 3]).

