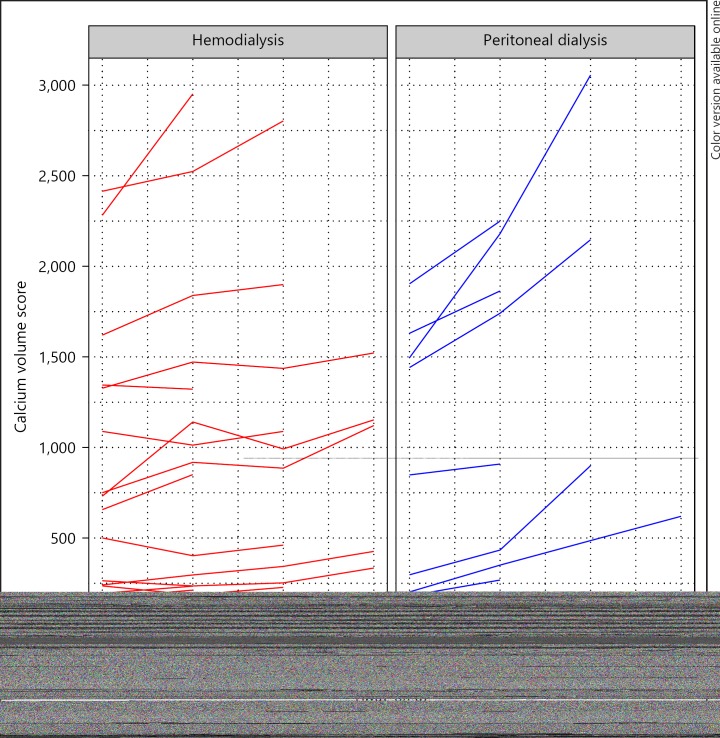
Fig. 1.
CAC progression in 57 patients on dialysis stratified by dialysis modality, depicted as individual trajectories of calcium volume scores. Individual trajectories of change in calcium volume score in patients on hemodialysis (left panel) and patients on peritoneal dialysis (right panel). Trajectories of 2 patients on hemodialysis and one on peritoneal dialysis with scores > 5,000 are not shown in this figure. Number of patients shown at 0, 1, 2, and 3 years: hemodialysis 32, 32, 21, and 10; peritoneal dialysis: 22, 22, 7, and 4. Note that lines may overlap around 0.

