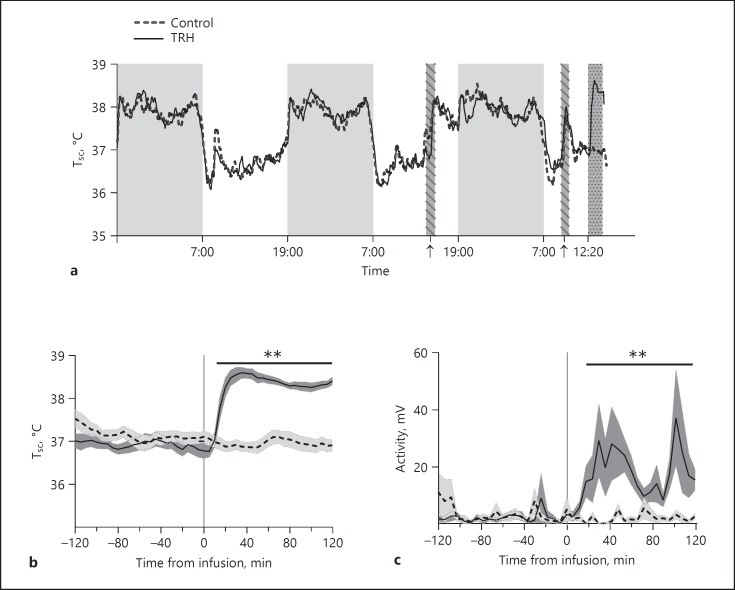
Fig. 4.
Effects of TRH administration in the PVN on subcutaneous body temperature and locomotor activity. a Daily rhythms in body temperature before and during the experiment. Grey areas without pattern indicate the active phase (i.e., 12-h dark period). The two striped bars marked by arrows indicate the times that the animals were connected to, respectively, the chain and tubing. The dark grey stippled bar indicates the 2-h period with TRH or vehicle administration. b Zoomed-in figure from a showing body temperature changes 2 h before and during the 2-h TRH or vehicle administration. c Locomotor activity 2 h before and during the 2-h infusion experiment. Shadows along the line denote the standard error. n = 8-10 per group. Two-way ANOVA was performed from t = 0 to t = 120 min. Asterisks indicate the overall significance of the Treatment effect. ** p < 0.01.

