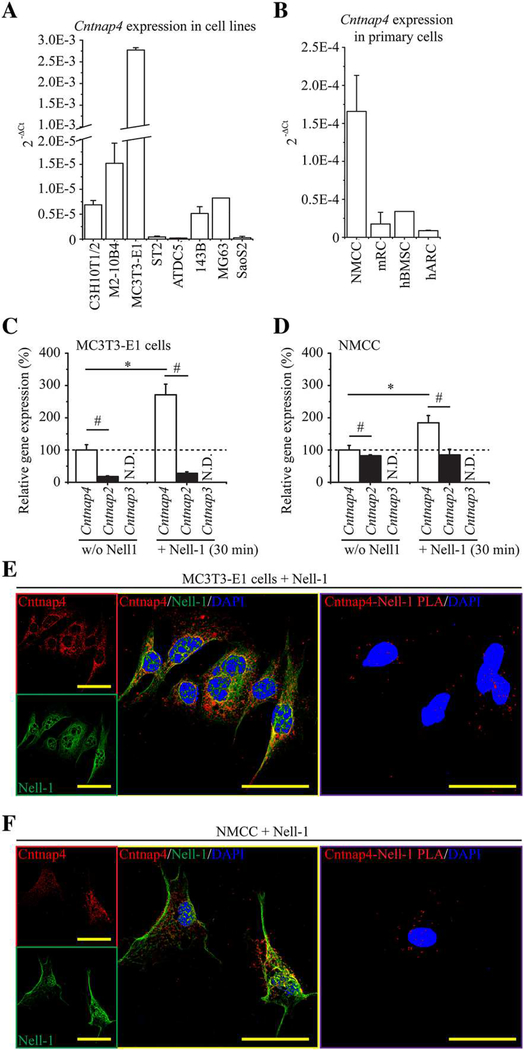
Fig. 2.
Cntnap4 and Nell-1 colocalization in osteogenic-committed cells. (A) Of the eight types of tested cell lines, MC3T3-E1 pre-osteoblasts expressed the highest levels of Cntnap4. (B) Of the four types of tested primary cells, NMCC exhibited the highest expression levels of Cntnap4. NMCC = newborn mouse calvarial cells. mRC = mouse rib chondrocytes. hBMSC = human bone marrow stem cells. hARC = human articular chondrocytes. Mean ± SEM of six independent experiments performed in triplicate is shown (A, B). In addition, Nell-1 significantly increased the levels of Cntnap4 in both MC3T3-E1 pre-osteoblasts (C) and NMCC (D). On the contrary, expression of Cntnap2, which was markedly lower than that of Cntnap4, was not responsive to Nell-1 simulation. Mean ± SEM of three independent experiments performed in duplicate is shown (C, D). *p < 0.05 when compared with the group without Nell-1 treatment; #p < 0.05 when compared with the Cntnap4 expression. Moreover, CLSM revealed the colocalization of Nell-1 and Cntnap4 in MC3T3-E1 pre-osteoblasts after 30 minutes of incubation with exogenous recombinant human Nell-1 (E). Colocalization was predominantly found on the plasma membrane. The direct Nell-1/Cntnap4 interaction was validated by Duolink PLA. Similar Nell-1 and Cntnap4 colocalization and protein interactions were also observed in the plasma membrane of NMCC with 30 minutes of Nell-1 treatment (F). Scale bar = 50 μm.

